Dashboards
The trackers carry where a client is (connected_to), how (connection) and on which radio
(radio, signal). A Markdown card turns that into lists, with nothing to install: add a card
of the type Markdown and paste one of the templates below as its content.
Who is where
Every client at home, grouped by the router or access point it uses:
{% set ts = states.device_tracker
   | selectattr('state', 'eq', 'home')
   | selectattr('attributes.connected_to', 'defined')
   | list %}
{% for g in ts | groupby('attributes.connected_to') %}
**{{ g.grouper }}** ({{ g.list | count }})
{% for s in g.list | sort(attribute='name') %}
- [{{ s.name }}](/history?entity_id={{ s.entity_id }}) · {{ s.attributes.connection }}{% if s.attributes.radio %} {{ s.attributes.radio }}, signal {{ s.attributes.signal }}{% endif %}
{% endfor %}
{% endfor %}
Each name links to the client's history.
By radio
Wi-Fi clients by band, with the device they use; useful to see what still uses 2.4 GHz:
{% set ts = states.device_tracker
   | selectattr('state', 'eq', 'home')
   | selectattr('attributes.radio', 'defined')
   | selectattr('attributes.radio', 'ne', none)
   | list %}
{% for g in ts | groupby('attributes.radio') %}
**{{ g.grouper }}** ({{ g.list | count }})
{% for s in g.list | sort(attribute='name') %}
- {{ s.name }} · {{ s.attributes.connected_to }}, signal {{ s.attributes.signal }}
{% endfor %}
{% endfor %}
The radio names are SRM's: 2.4G, 5G, and 5G-2 for a second 5 GHz radio.
A complete dashboard
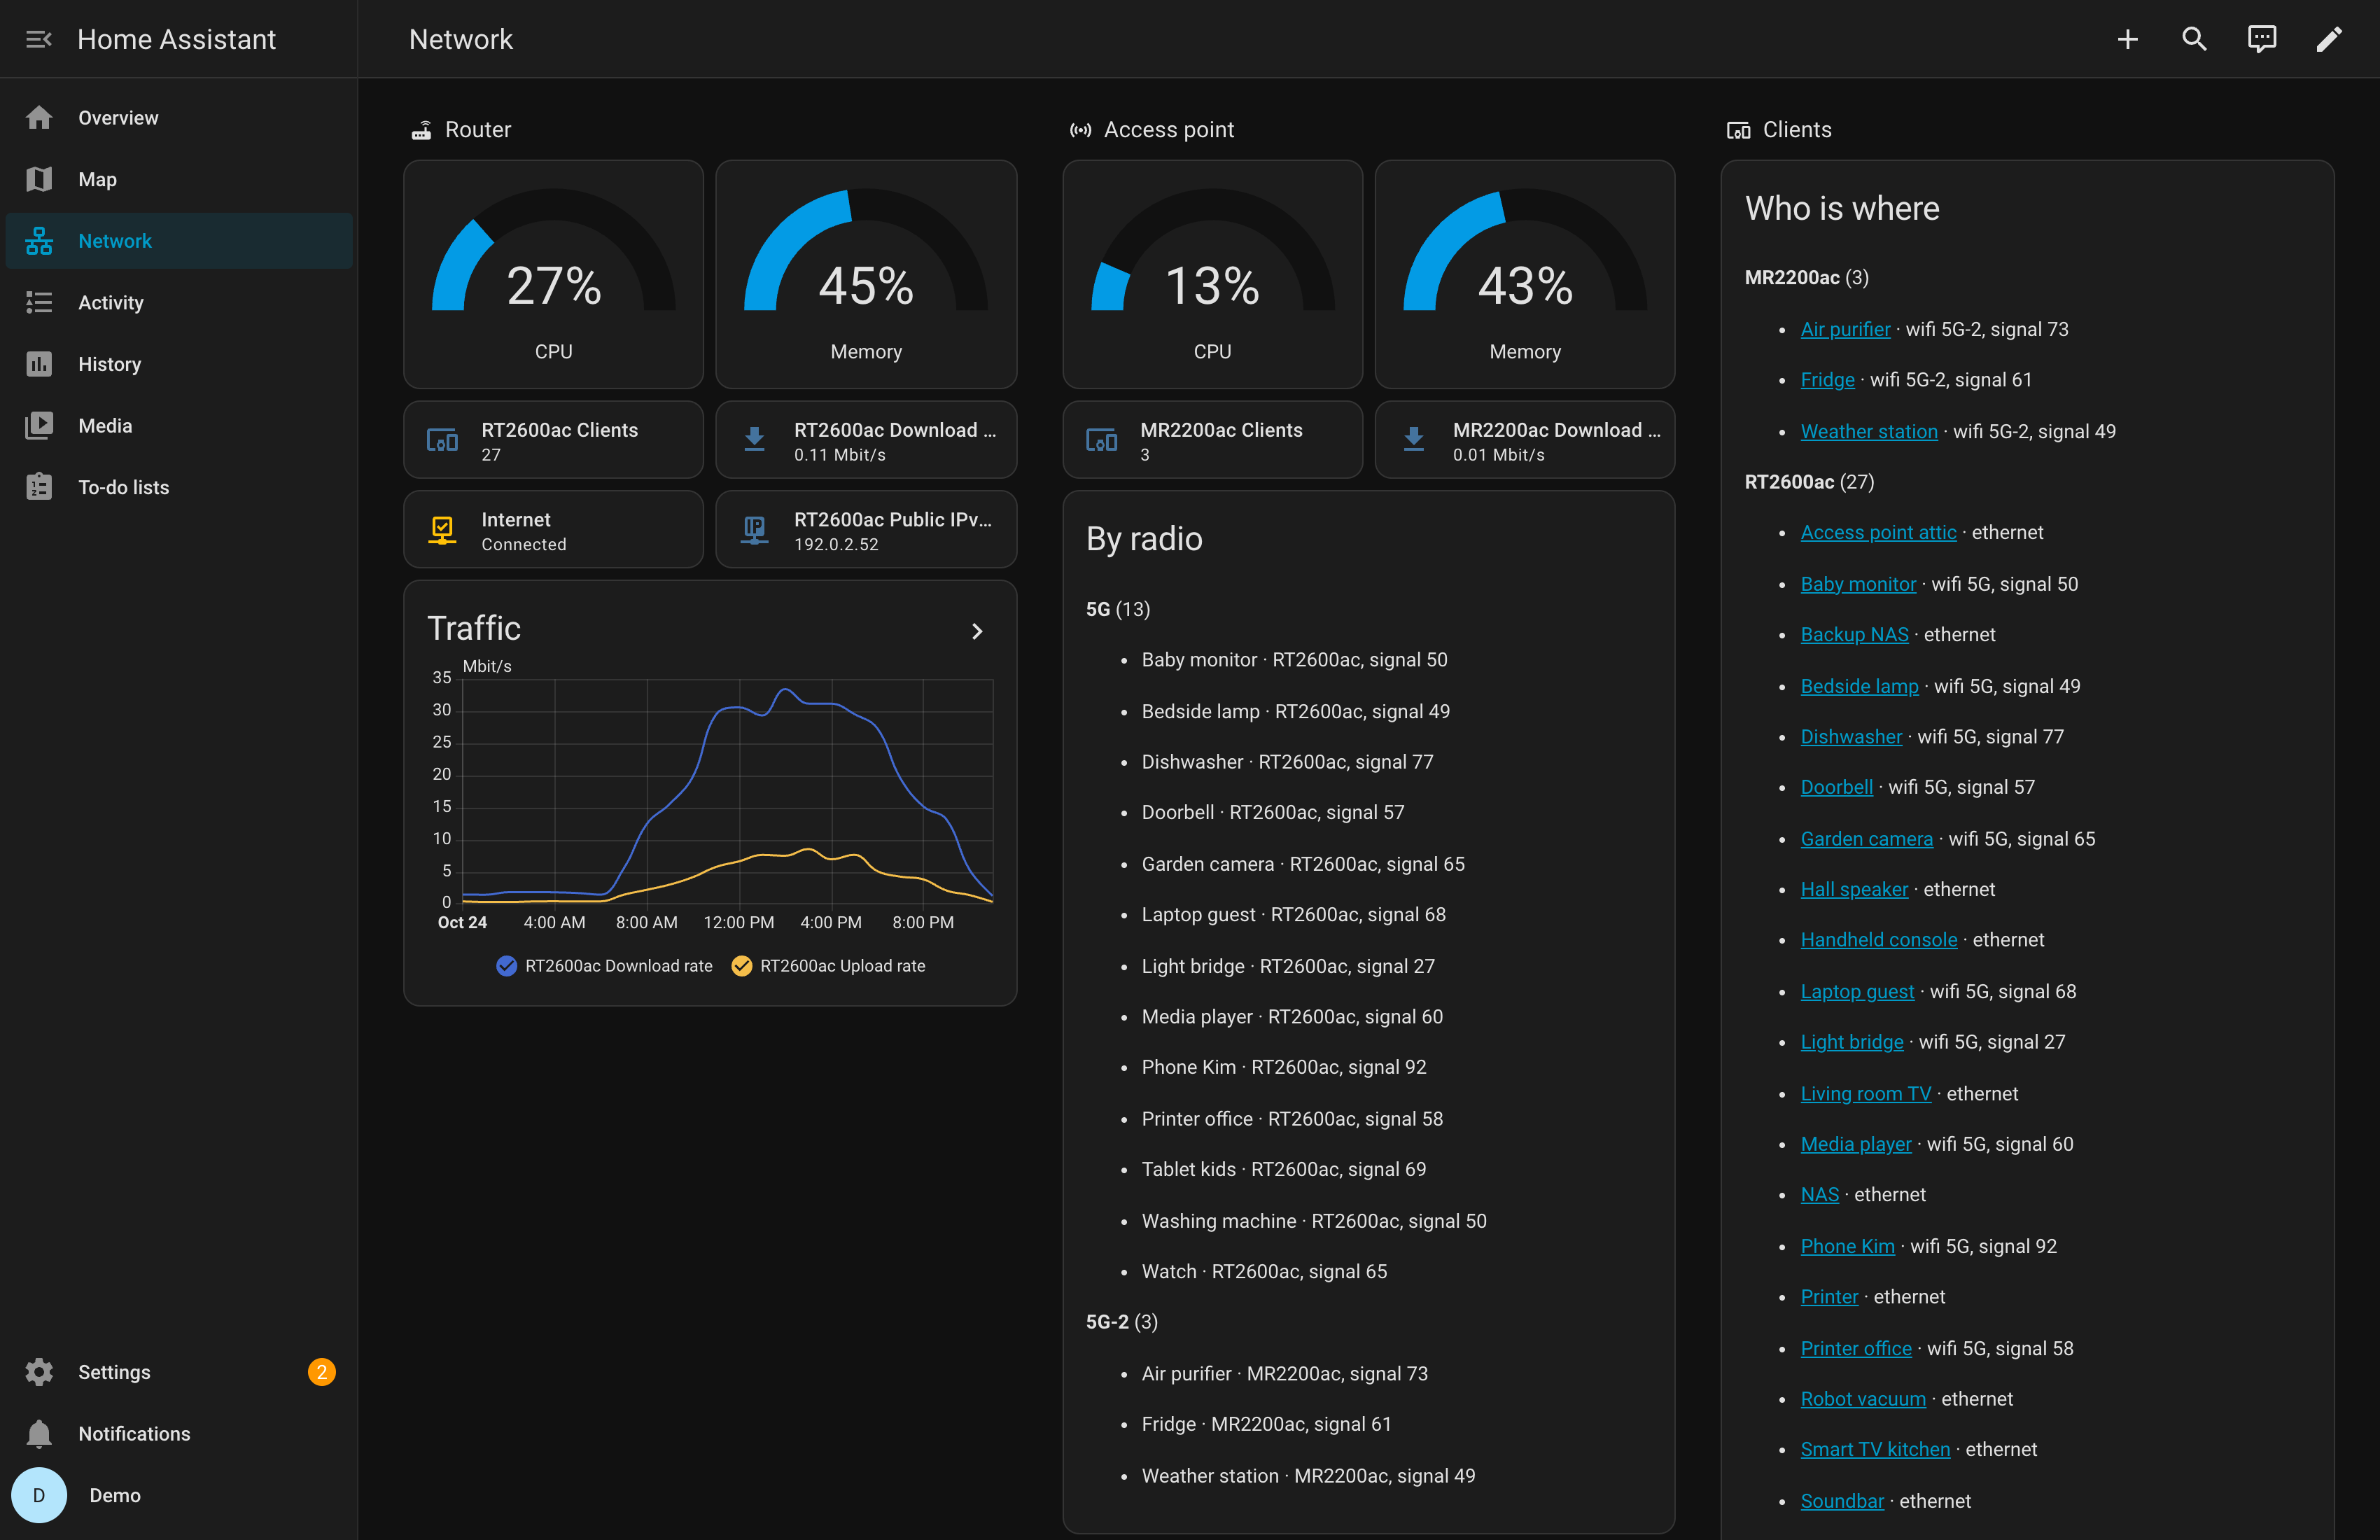
Router and access point with gauges, tiles and a traffic graph, plus both lists above. Download it or copy it from here; the comment at the top says where to paste it and which entity IDs to adjust.
# Example dashboard for Synology SRM Router: Settings, Dashboards, Add dashboard, "New dashboard
# from scratch", then the three dots, Raw configuration editor, and paste this. Replace rt2600ac
# and mr2200ac with your devices' entity ID prefixes (the model names, lower case).
views:
  - title: Network
    type: sections
    max_columns: 3
    sections:
      - type: grid
        cards:
          - type: heading
            heading: Router
            icon: mdi:router-wireless
          - type: gauge
            entity: sensor.rt2600ac_cpu_load
            name: CPU
            grid_options: {columns: 6}
          - type: gauge
            entity: sensor.rt2600ac_memory_usage
            name: Memory
            grid_options: {columns: 6}
          - type: tile
            entity: sensor.rt2600ac_clients
            grid_options: {columns: 6}
          - type: tile
            entity: sensor.rt2600ac_download_rate
            grid_options: {columns: 6}
          - type: tile
            entity: binary_sensor.rt2600ac_wan_connection
            name: Internet
            grid_options: {columns: 6}
          - type: tile
            entity: sensor.rt2600ac_public_ipv4_address
            grid_options: {columns: 6}
          - type: statistics-graph
            title: Traffic
            entities:
              - sensor.rt2600ac_download_rate
              - sensor.rt2600ac_upload_rate
            days_to_show: 1
            period: hour
            stat_types: [mean]
            chart_type: line
      - type: grid
        cards:
          - type: heading
            heading: Access point
            icon: mdi:access-point
          - type: gauge
            entity: sensor.mr2200ac_cpu_load
            name: CPU
            grid_options: {columns: 6}
          - type: gauge
            entity: sensor.mr2200ac_memory_usage
            name: Memory
            grid_options: {columns: 6}
          - type: tile
            entity: sensor.mr2200ac_clients
            grid_options: {columns: 6}
          - type: tile
            entity: sensor.mr2200ac_download_rate
            grid_options: {columns: 6}
          - type: markdown
            title: By radio
            content: |
              {% set ts = states.device_tracker
                 | selectattr('state', 'eq', 'home')
                 | selectattr('attributes.radio', 'defined')
                 | selectattr('attributes.radio', 'ne', none)
                 | list %}
              {% for g in ts | groupby('attributes.radio') %}
              **{{ g.grouper }}** ({{ g.list | count }})
              {% for s in g.list | sort(attribute='name') %}
              - {{ s.name }} · {{ s.attributes.connected_to }}, signal {{ s.attributes.signal }}
              {% endfor %}
              {% endfor %}
      - type: grid
        cards:
          - type: heading
            heading: Clients
            icon: mdi:devices
          - type: markdown
            title: Who is where
            content: |
              {% set ts = states.device_tracker
                 | selectattr('state', 'eq', 'home')
                 | selectattr('attributes.connected_to', 'defined')
                 | list %}
              {% for g in ts | groupby('attributes.connected_to') %}
              **{{ g.grouper }}** ({{ g.list | count }})
              {% for s in g.list | sort(attribute='name') %}
              - [{{ s.name }}](/history?entity_id={{ s.entity_id }}) · {{ s.attributes.connection }}{% if s.attributes.radio %} {{ s.attributes.radio }}, signal {{ s.attributes.signal }}{% endif %}
              {% endfor %}
              {% endfor %}